MonitorActivity
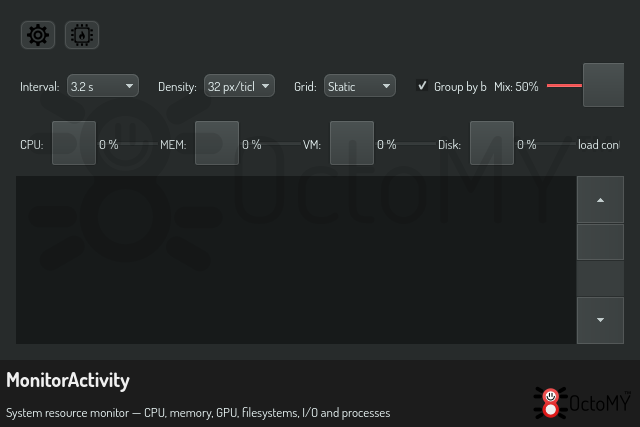
System resource monitor — CPU, memory, GPU, filesystems, I/O and processes, with a facts column of capacity, temperature and health beside every chart
The process list colors each row by its load: red for CPU, green for memory, blue for VRAM. Up to one core a color is as strong as the load; past one core it turns toward white, one step per doubling, until the whole machine is white. A white or black NAME cell marks a new or an ended process. See Reading the colors.
Properties
- ID:
MonitorActivity - Path:
activities/monitor/MonitorActivity - Tags: activity, monitor, system, resources
- Modes: default
Modes
default
Related Widgets
- ActivityOrbWidget - Central activity indicator with concentric rings for discovery/pairing/comms
- ActivityStack - Stack-based navigation for Activity views
- AssociateDetailActivity - Activity showing detailed information about a connected associate
- BatchJobDetailResources - Job detail — what a job requested, its limit, and the service class derived from...