Monitor system resources
Watch live CPU/memory/GPU graphs and apply synthetic load from the Monitor activity
The Monitor activity is HUB's htop-like live resource monitor: a scrolling stack of CPU heatmap, memory/swap, filesystem, disk/net I/O and GPU charts plus a process list. This guide covers the two things you drive from its toolbar — configuring the view and applying synthetic load for stability testing.
Open it
In HUB, open the Monitor activity from the menu. By default you see just a thin toolbar above the graphs — the monitor is for watching, so the controls stay out of the way until you summon them.
On Windows
The monitor reads the same things on Windows as on Linux, from the sources Windows' own tools use: CPU use per logical core with its user, kernel, DPC and interrupt shares; memory, the system cache and the paging file; each graphics adapter's load and video memory; disk and network rates; every fixed and removable drive; and every process with its CPU, memory, disk rates, GPU load and video memory.
Some things are not shown on Windows: the CPU temperature (Windows gives none to a program without a driver), the memory module temperatures, the health of a SATA drive (it needs administrator rights), and a process's command line (its image path is shown instead). The facts column says so where a value is missing. See What each system can show.
Configuring the view
Click the cog button in the toolbar to reveal the configuration panel; the graphs slide down to make room, and click again to hide it (the graphs reclaim the space). The open/closed state is remembered per node.
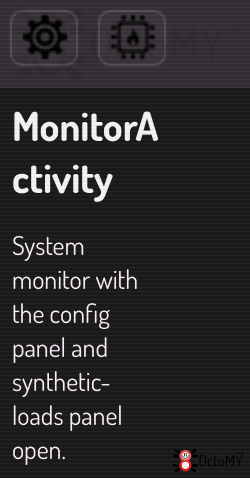
The panel holds the view controls:
- Interval — how often the monitor asks for a sample (50 ms – 5 s). It sets the cadence of the request, not a guarantee that a reading arrives; see When a graph shows red dots.
- Density — horizontal pixels per sample; lower values pack more history into the same width.
- Grid — Static keeps the time rulers fixed to the window (data scrolls under them); Follow data makes them wall-clock rulers that scroll with the data.
- Mix — blends every chart's color toward the shared base color, and the process list's load colors with them, the white at the top of the scale included.
- Group by binary — one row per program instead of one per process. See Reading the process list.
- Facts — the facts column right of each donut: the capacity and the condition of each part of the machine. It is on by default. Off gives the charts the full width of their right block again. See Reading the facts column.
- Measure now — measure the speed of each kind of CPU core now. The button is disabled while a measurement runs, and its tooltip says when the last one ran. See Measuring the speed of a core.

Reading the process list
Below the graphs, the process list shows what is using the machine, sorted by a blended usage score. Each row carries a heat strip of its own history.
When one program takes the whole list
A parallel linker or a compile farm forks dozens of times. Those processes have the highest scores on the machine, so they take the top dozens of rows, and your editor and your browser are pushed off the bottom. The list stops describing the machine at the moment you look at it.
Tick Group by binary in the configuration panel. The list folds to one row
per program: clang once instead of sixty-four times, with the resources of
all sixty-four added up.
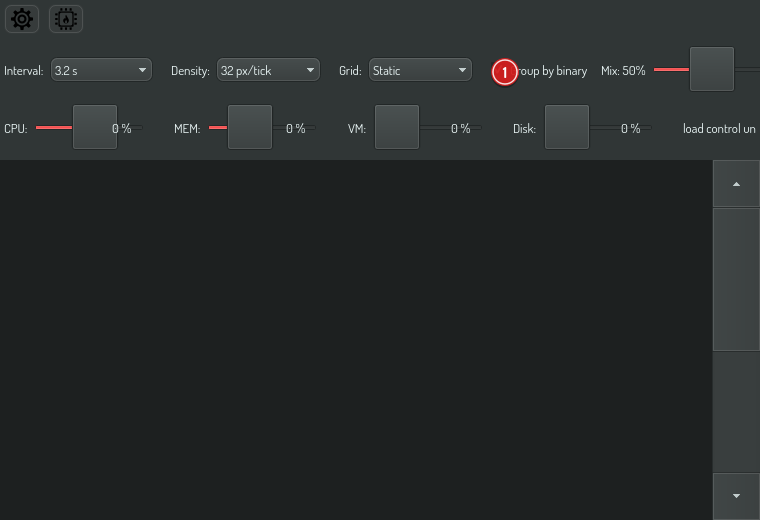
Nothing is hidden. A program running as a single process becomes a group of one, so every process is still on screen somewhere. The setting is remembered per node.
What a grouped row shows
- The PROCS column replaces the PID with the number of processes,
×64. - The COMMAND column shows the arguments those processes have in common.
When they do not all agree, it says so:
… 40 of 64means forty of the sixty-four share what you see, and the rest were invoked differently. - Hover a row for the shared path, the totals, and the five busiest members with their own pids — that is how you find which of the sixty-four is doing the work.
- Right-click for the group: copy every pid, the binary path, the shared command, or all of the command lines.
Two numbers worth understanding
Percentages are per core. 100% means one core's worth, for processor time,
for memory and for video memory. A row reading 900 is using nine cores, or
nine cores' worth of memory. That keeps the columns comparable at a glance.
Grouped memory is a sum and it over-counts. Processes of the same program share parts of their memory, and adding their figures counts those shared parts once for each process. Read a grouped memory figure as an upper bound. The hover tip says so too.
Reading the colors
Each row is colored by its load: red is processor time, green is memory and blue is video memory (VRAM). The GPU% column has no color of its own.
- A faint color is part of one core. The color grows from clear to full as the load grows to one core's worth, so a process using half a core shows its color at half strength.
- A full color is one core.
- Past one core the color turns white, one equal step for every doubling: two cores, four, eight and so on, until the whole machine is white. On a 64-core machine, 8 cores look as different from 4 as 64 do from 32, so a heavy build keeps its detail instead of saturating.
- The larger load sets the hue. A build using 28 cores of processor time and 10 cores' worth of memory reads as a warm, nearly white red, because processor time is three quarters of its load.
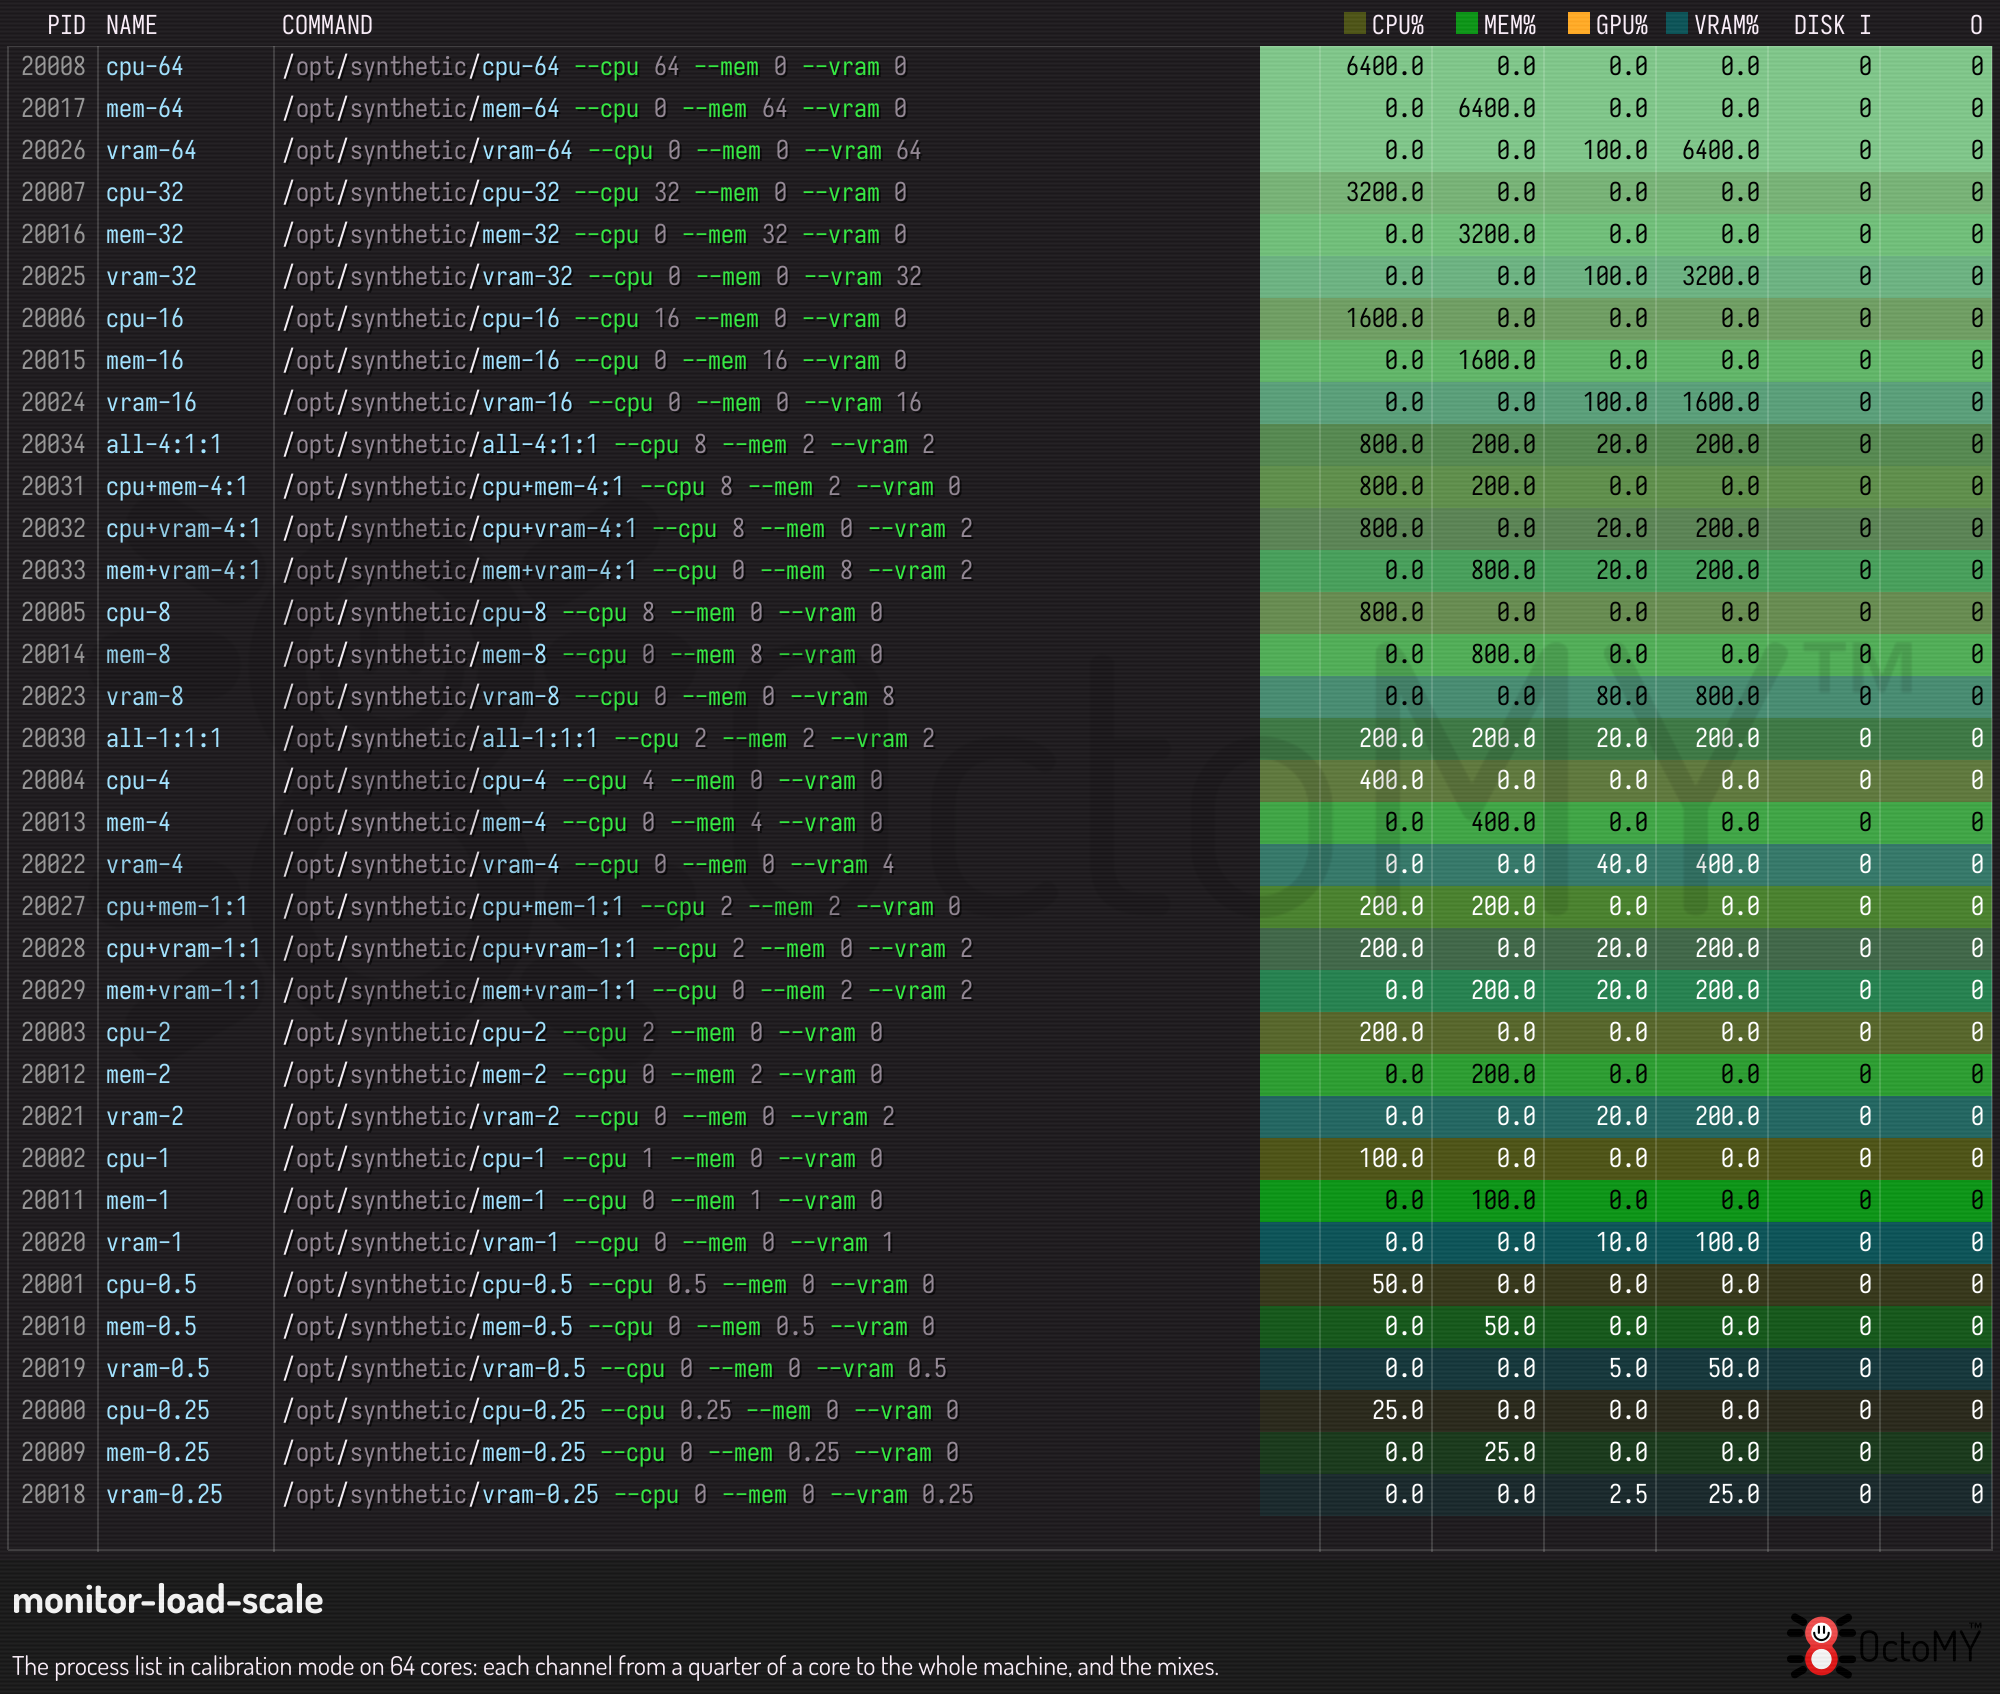
The numbers of a row are drawn in black or white, whichever reads better on that row's color, and the command line over the history strip carries a thin shadow, so both stay readable from a clear row to a white one.
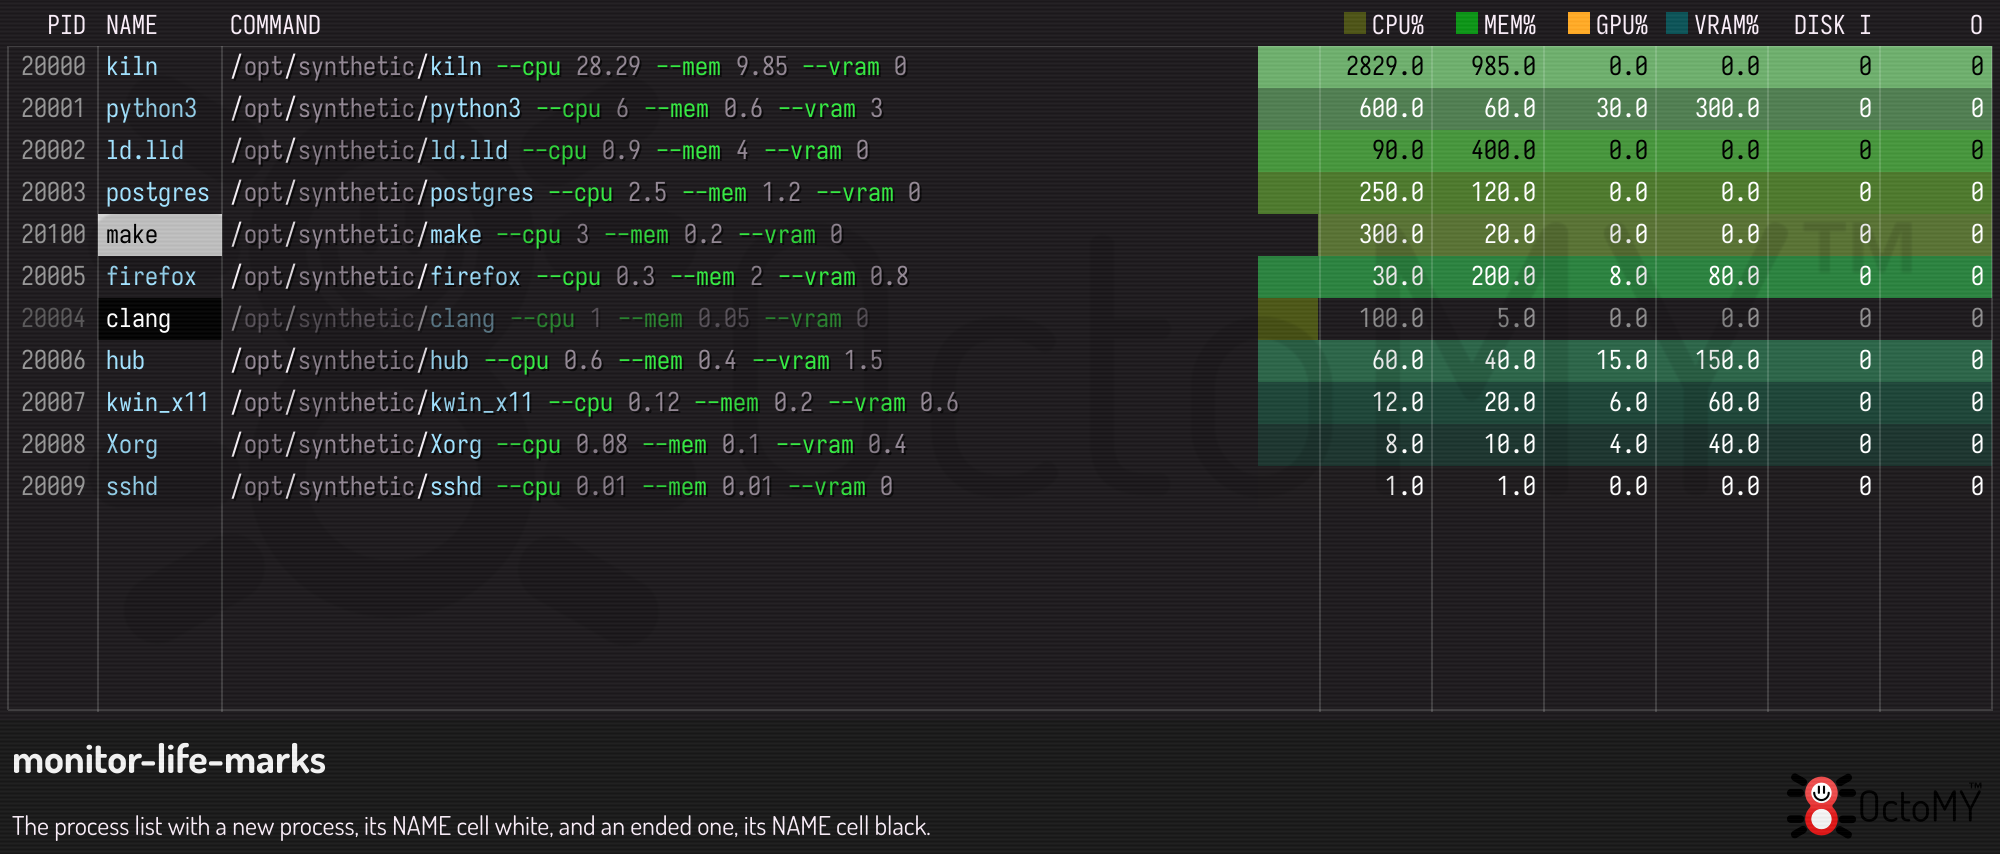
New and ended processes are marked on their NAME cell only, so the rest of the row keeps its load color. A process that has just started has a white NAME cell for a few updates. A process that has ended has a black NAME cell while it lingers, and its numbers fade.
The Mix option tints the load colors along with the charts, white included, so the list matches the rest of the view.
Sorting and pinning rows
Click a column header to sort the list by that column, highest first. Click the same header again to sort it lowest first, and a third time to go back to the default order, the blended usage score. An arrow in the header shows the column and the direction. PID sorts by process id, or by the process count on a grouped row. NAME and COMMAND sort by the program's name. The grouped and the ungrouped list share one sort, so ticking Group by binary keeps the order you chose.
Left-click a row to pin it. A pinned row moves to the top of the list, under any rows pinned before it, and carries a dark wash and a pin before its id. A pinned process that ends stays in the list, with its history frozen, until you click it again to unpin it. The grouped and the ungrouped list keep their own pins.
Reading the facts column
Right of each chart, beside its donut, the facts column shows what the hardware of that section is and how it is. It lines up with the last two number columns of the process list.
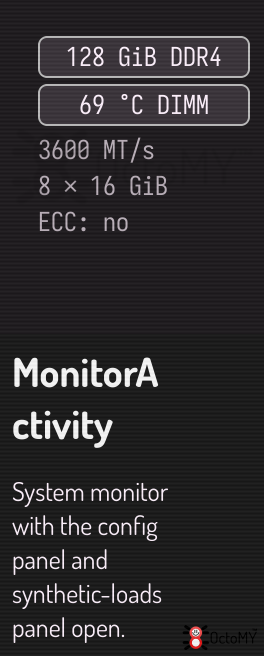
Each section shows two badges, one above the other:
- Capacity — what the hardware can do or hold:
32C · 64Tfor the CPU,128 GiB DDR4for the memory,1 Gbit/s fullfor the network,1.8 TiB NVMefor a filesystem. - Condition — the temperature of the hardware, or a health alert when one
is active:
71 °C,SMART crit,96 % full.
A tall section also shows fact lines under the badges: clocks, caches, module speeds, the measured speed of a disk or a core. What does not fit is never lost: the hover card holds every fact.
The four colors
| Color | Meaning |
|---|---|
| Plain | Nothing is wrong, or no rule applies. |
| Amber | Close to a limit, or a minor alert: within 10 °C of the device's own warning limit, 95 % full, ECC errors corrected in the last hour. |
| Red | At a limit, or a defect: at the device's warning limit, a SMART alert, a link that is down, 99 % full. |
Grey — |
The system does not give the value. |
The monitor never invents a limit. A device that reports no warning limit shows its temperature in plain color, and the hover card says "the device reports no limit". An AMD processor and most memory modules are such devices.
A dash is not a zero. — °C means that no sensor gives a temperature; it
never means 0 °C. The hover card says why the value is missing, for example
"Windows gives no CPU temperature to a program without a driver".
The hover card
Hold the pointer over a section's facts to see the card. It lists every fact of the section in groups: the capacity, the condition, then one group per device. A row in color shows its role with a swatch. Where a section has many drives, the drives with an alert come first, then the hottest. A drive's SMART data says how old it is, because the system refreshes it every 10 minutes.
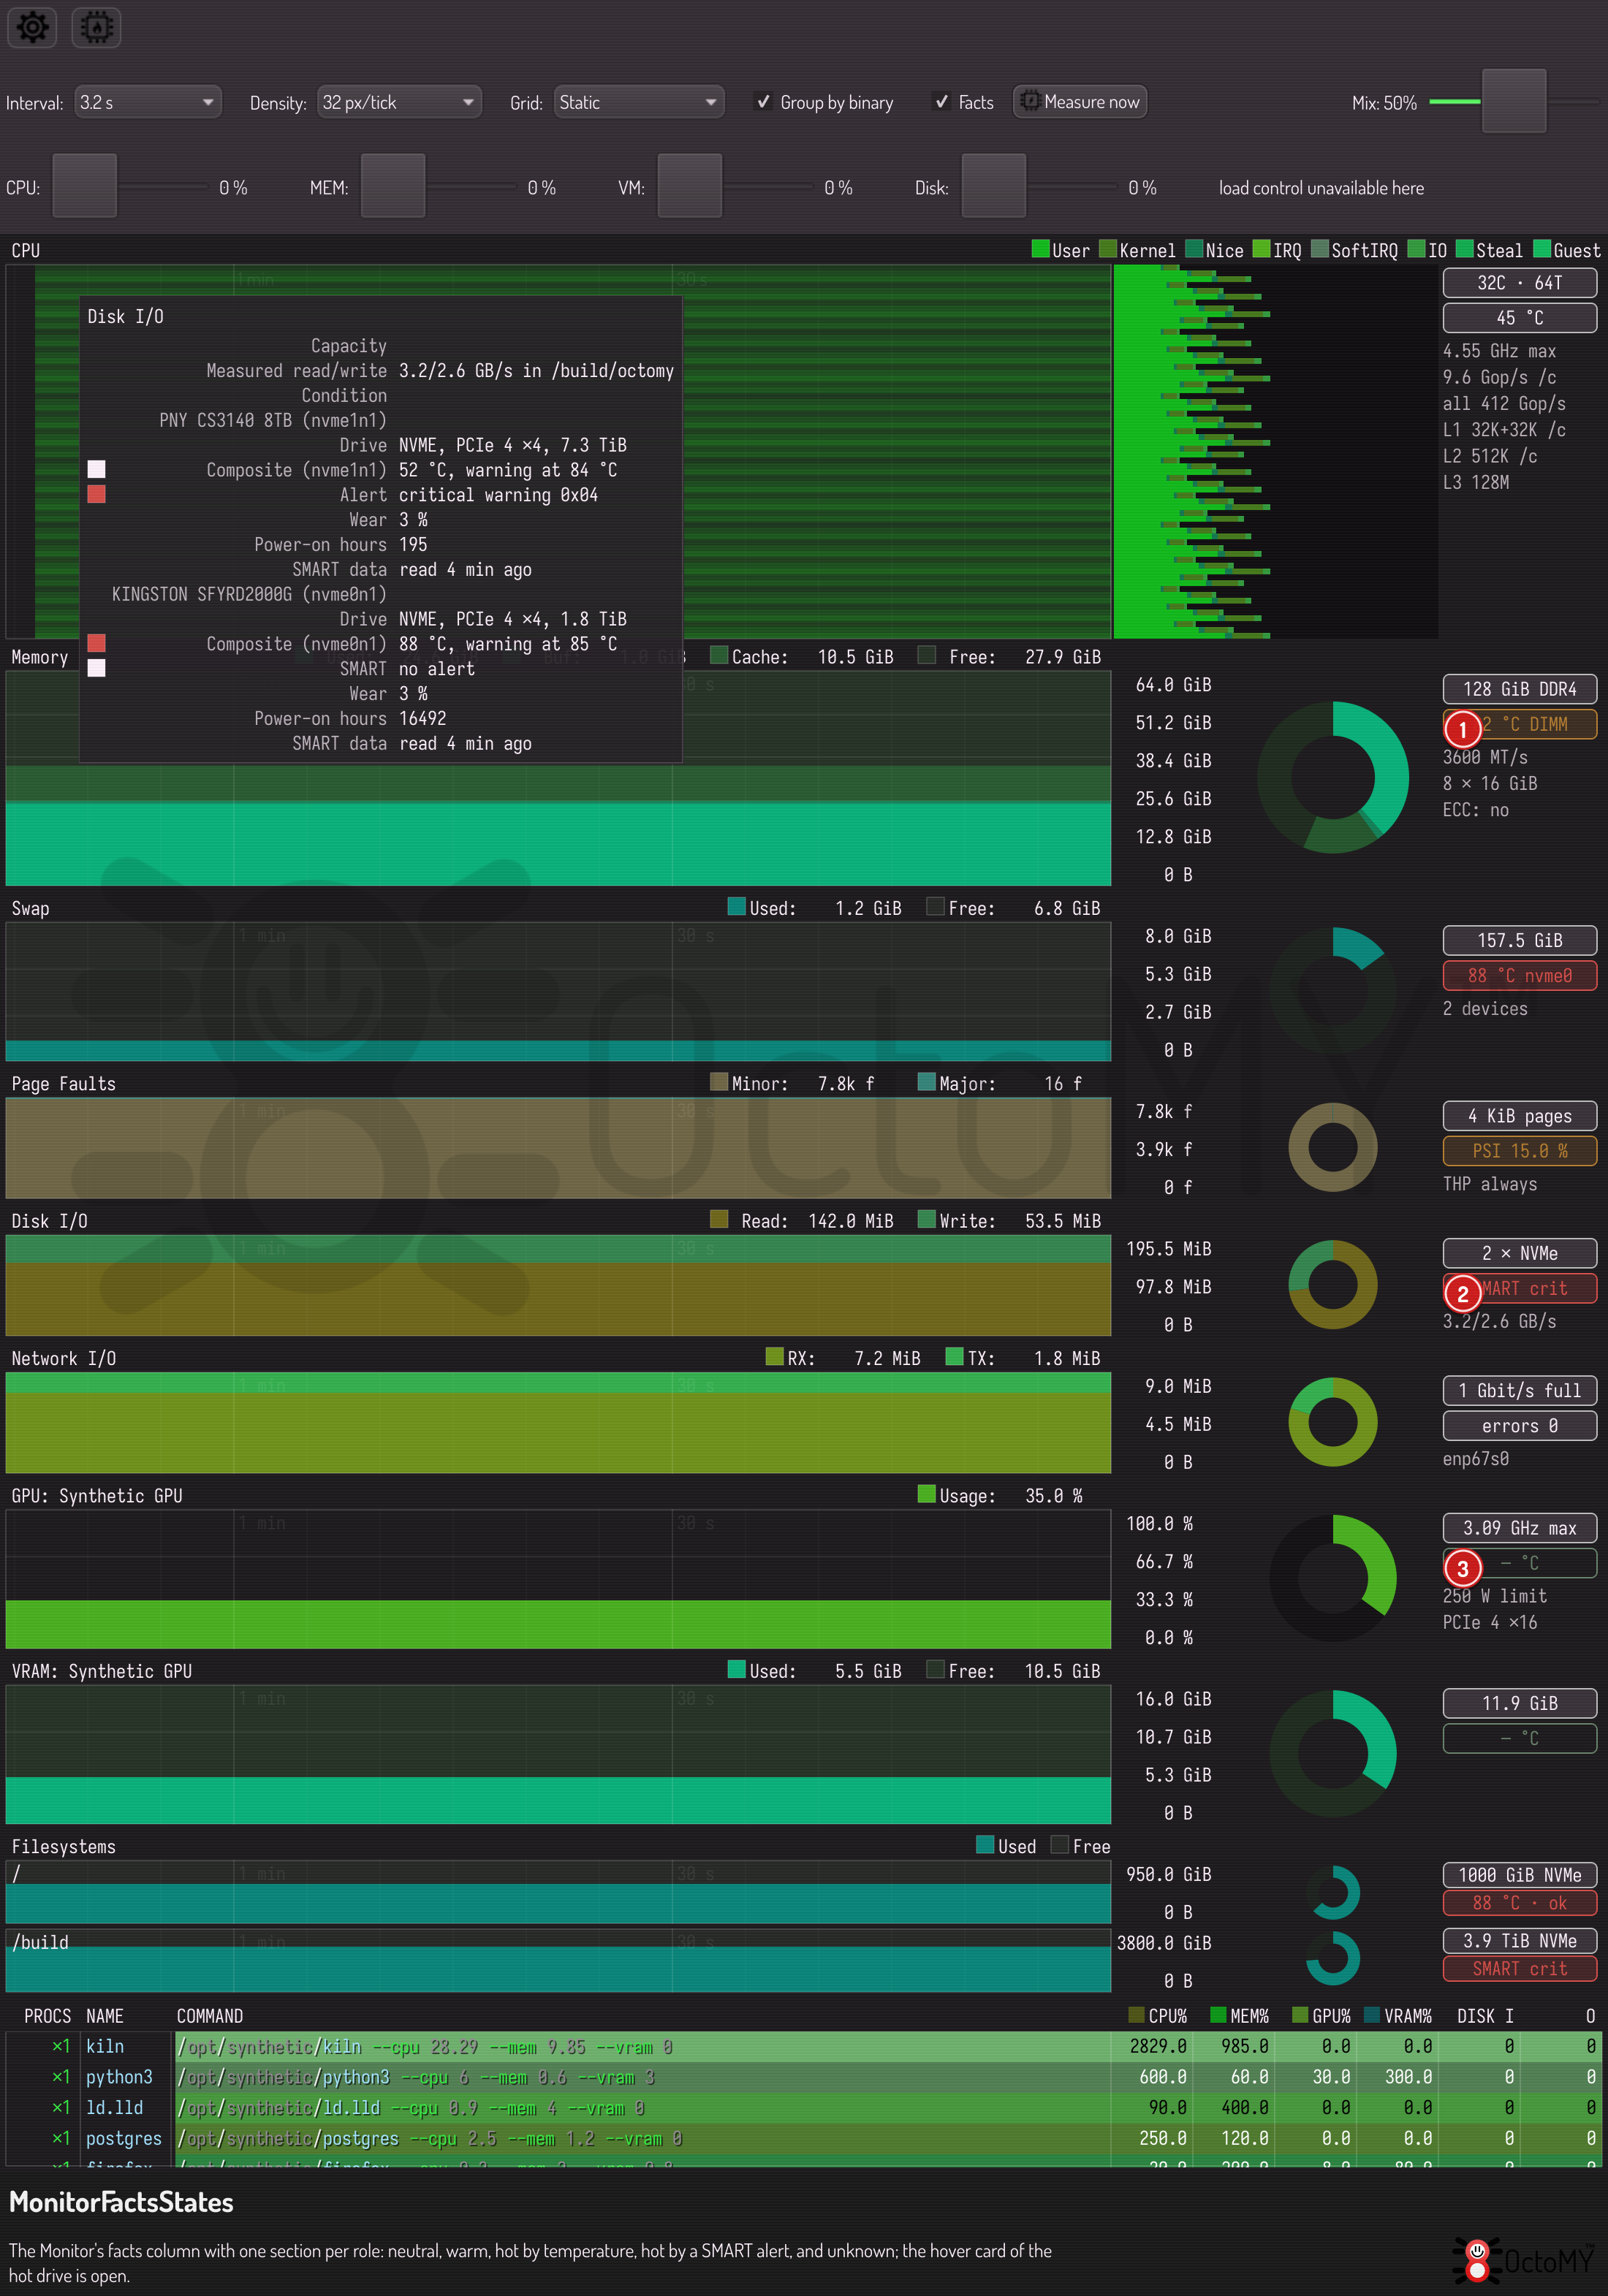
The monitor reads temperatures and drive health only while it shows, because reading an NVMe drive's temperature is a command to the drive.
Measuring the speed of a core
No operating system tells how many operations a core does per second, and the
clock speed compares only cores of one design. So the monitor measures it. It
runs a fixed calculation on one core of each physical core in turn, pinned to
that core, and reports the result in billions of kernel operations per second
(Gop/s) per core: 9.6 Gop/s /c on a uniform CPU, P 9.6 · E 4.1 on a
CPU with performance and efficiency cores. Then it runs on every core at once
for one second: all 412 Gop/s.
The number is real and compares across processors of any vendor and design. It describes this calculation's mix of integer and floating-point work. It is not a general score, and it moves by a few percent with the load and the temperature.
The measurement runs once per machine, by itself, when the node has no work
and the machine stayed idle for 5 seconds. A machine that is never idle shows
not measured until you press Measure now. That button runs it at once,
also on a busy machine, and the hover card then says how busy the machine was
during the run.
What each system can show
| Section | Linux | Windows | Android |
|---|---|---|---|
| CPU capacity | Cores, classes, caches, clock | Cores, classes, caches, clock | Cores, classes, caches when the system gives them |
| CPU temperature | Yes | No: it needs a driver | The thermal status of the device |
| Memory | Size, type, speed, module temperatures, ECC | Size, type, speed | Size |
| Swap | Each swap device | The page file | Compressed swap in memory, when readable |
| Drives | Model, link, temperature, SMART health | Temperature, NVMe health; no SATA health | Size |
| Network | Speed, duplex, errors | Speed, errors; no duplex | Wi-Fi speed and signal |
| GPU | NVIDIA and AMD clocks, power, temperature, link | Temperature, power share, fan | None |
When a graph shows red dots
A small red dot under a graph column means the monitor took no measurement for that moment. An amber dot means it measured the levels — memory, swap, filesystem — but could not work out the rates for that column, because the reading arrived too late to divide by the time it covers.
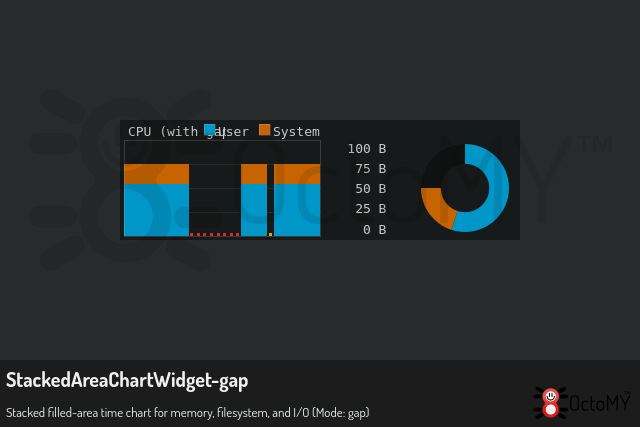
Where a dot appears, the graph leaves the column empty. That is deliberate. The monitor will not repeat the previous value or draw a zero, because both of those look exactly like a healthy idle machine — which is the opposite of what is happening. The process list dims for the same reason: the rows are still the last good reading, so they stay on screen rather than vanishing, but they are no longer current.
A run of red dots under heavy load is the monitor working correctly. Reading
the kernel's counters (/proc on Linux, the performance counters on Windows)
means waiting on the kernel, and a heavily loaded machine can make that
wait take seconds. The monitor keeps drawing on time and marks what it missed.
If dots appear on an idle machine, that is worth investigating — it points at storage or memory pressure rather than at the monitor.
Applying synthetic load
Click the stress button in the toolbar to open the synthetic-loads panel.
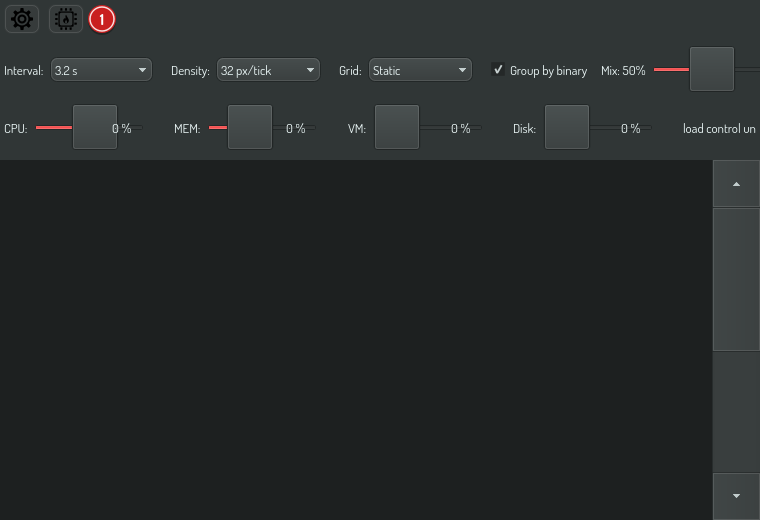
Drag the CPU load or MEM load slider and watch the effect live in the graphs above: the CPU heatmap reddens as cores saturate, and the memory chart's used band grows. There is no separate "on" switch — any non-zero percent is active, shown by the ● active chip; the danger-red Clear button drops all load in one click.

The load runs in a per-node service independent of this activity — it keeps running if you navigate away, and it is never persisted, so a fresh HUB always starts idle (a machine must never boot into self-inflicted load).
You can't lose the off switch
While any load is active, two safety affordances kick in:
- The loads panel cannot be hidden — the stress toggle locks open (its tooltip explains why). Press Clear first to unlock it.
- A danger-red return button appears in the header on every other screen. Click it to jump straight back to Monitor and the running sliders. It disappears the moment load drops to zero.
Together these guarantee the load controls are always one click away while the machine is under deliberate stress.
Applying load headlessly (OPAL)
For automated load-testing there is a system.load.* task family that drives
the very same service — so a load set this way shows up live in the graphs and
raises the same header return button:
hub --opal 'system.load.set cpu=50'
hub --opal 'system.load.status'
hub --opal 'system.load.clear'
See the system.load.* task reference for
the full parameter and output details.
The facts column has tasks too. system.monitor.facts returns every section's
badges, lines and hover card as the screen shows them, system.inventory.health
returns the temperatures and the health of the hardware, and
system.inventory.measure runs the speed measurement:
hub --opal 'system.monitor.facts' -c
hub --opal 'system.inventory.health' -c
hub --opal 'system.inventory.measure force=true' -c