Debug a Plan
Find and fix issues in your OPAL plans
Debug a Plan
Find and fix issues in your OPAL Plans using built-in debugging tools.
Pro Tip
Add
log()statements liberally during development - they're your best friend for understanding plan behavior. You can always remove them or change tolog_debug()for production use.
Debugging tools
OctoMY™ provides several debugging features:
| Tool | Purpose |
|---|---|
| Log Output | View plan messages |
| Variable Watch | Monitor variable values |
| Breakpoints | Pause at specific lines |
| Step Execution | Run line by line |
| Sensor Monitor | Live sensor values |
Using log output
Adding log statements
plan DebugExample {
    loop {
        var distance = sensors.distance.front
        log("Distance reading: " + distance + "cm")

        if distance < 30 {
            log("WARNING: Obstacle detected!")
            log("Taking evasive action")
            avoid_obstacle()
        }

        delay(100)
    }
}
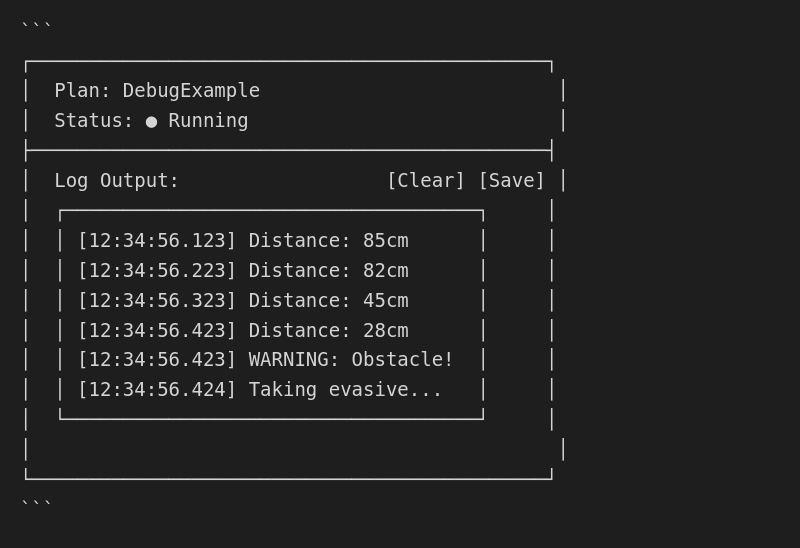
Viewing logs
Open the log panel while plan is running:
Log levels
log("Normal message")           # INFO level
log_debug("Debug details")      # DEBUG level (verbose)
log_warn("Warning message")     # WARNING level
log_error("Error occurred!")    # ERROR level
Filter logs by level in the UI dropdown.
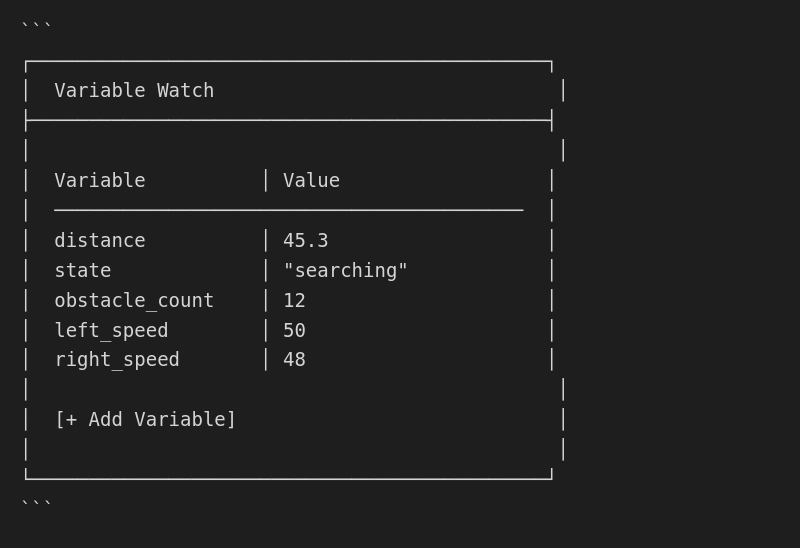
Variable watch
Monitor variable values in real-time:
Enable watch
- Click [Debug] button
- Select Variable Watch
- Add variables to watch list
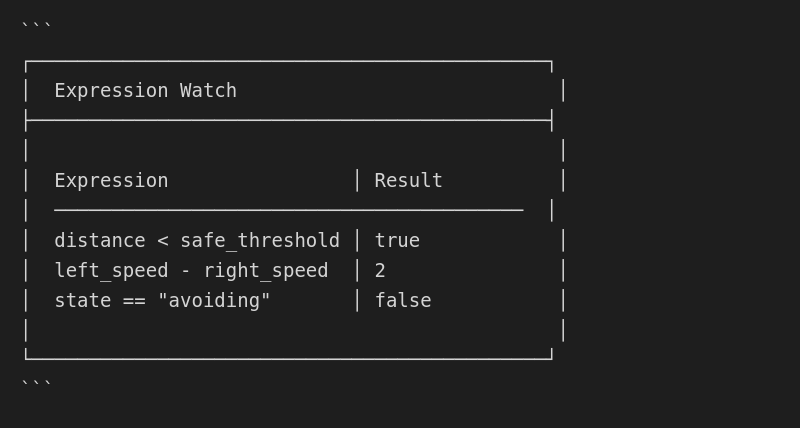
Watch expressions
Watch calculated values:
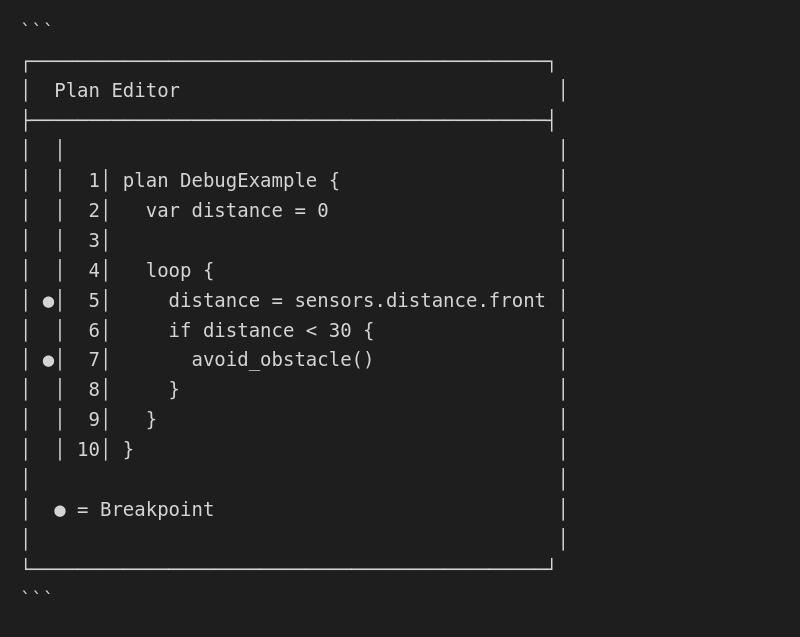
Breakpoints
Pause execution at specific lines:
Set a breakpoint
Click the line number in the editor:
Breakpoint controls
When paused at a breakpoint:
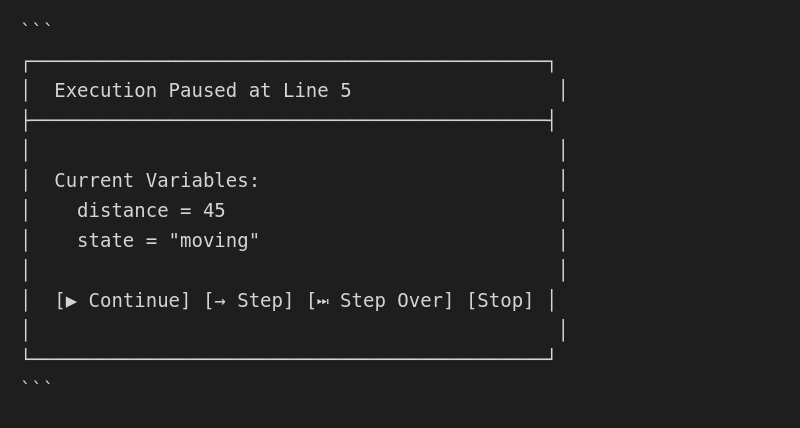
| Button | Action |
|---|---|
| Continue | Resume until next breakpoint |
| Step | Execute one line, enter functions |
| Step Over | Execute one line, skip function internals |
| Stop | End execution |
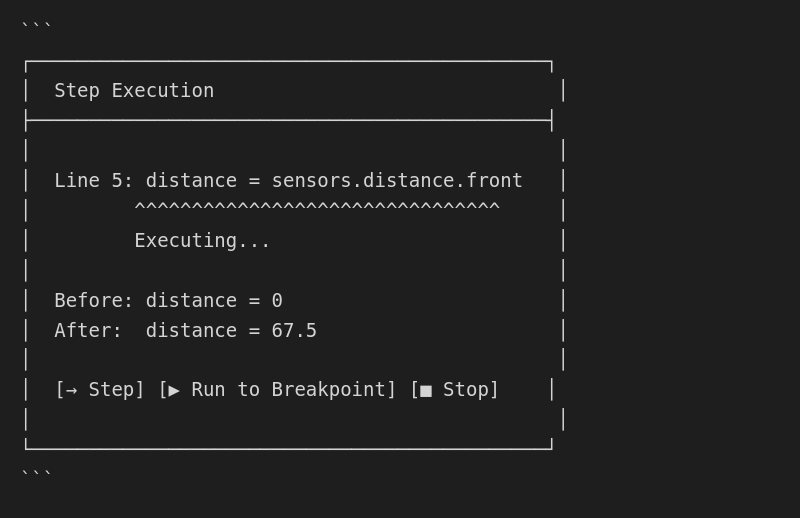
Step execution
Run your plan line by line:
Start step mode
- Click [Debug] → [Step Mode]
- Plan starts paused at first line
- Click [Step] to advance
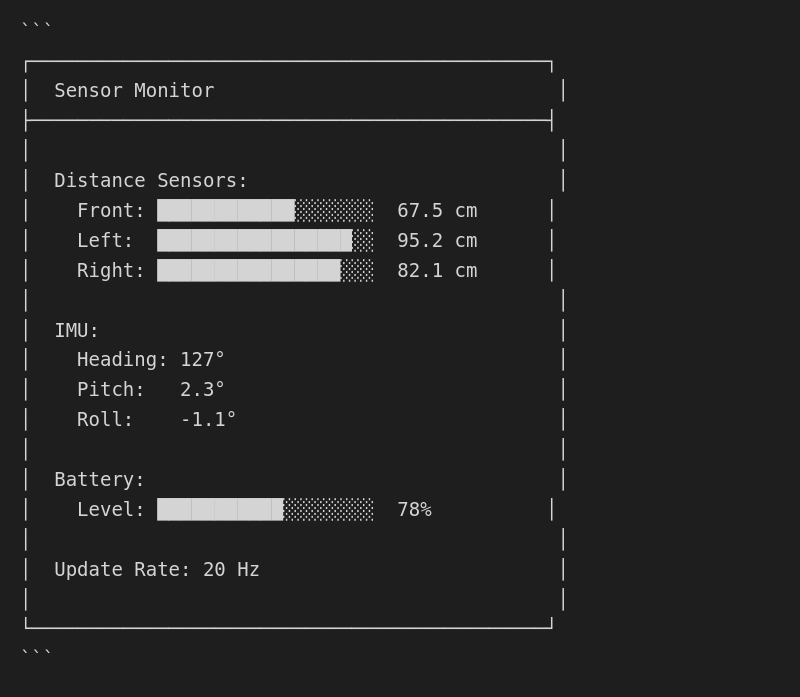
Sensor monitor
View live sensor data while debugging:
Common errors
Syntax errors
Error at line 5: Unexpected token '}'
Solution: Check for missing brackets, parentheses, or semicolons.
# Wrong
if distance < 30
    avoid_obstacle()
}

# Correct
if distance < 30 {
    avoid_obstacle()
}
Undefined variable
Error at line 7: Variable 'distanc' is not defined
Solution: Check variable spelling.
# Wrong
var distance = 50
if distanc < 30 {  # Typo!

# Correct
var distance = 50
if distance < 30 {
Type mismatch
Error at line 4: Cannot compare string to number
Solution: Ensure types match in comparisons.
# Wrong
var state = "running"
if state < 30 {  # String vs number!

# Correct
var state = "running"
if state == "running" {
Sensor not found
Error: Sensor 'distance.rear' not found
Solution: Verify sensor name and that hardware is configured.
# Check available sensors first
log(sensors.list())
Performance issues
Plan running slow
Cause: Loop running too fast without delay.
# Bad - uses 100% CPU
loop {
    check_sensors()
    # No delay!
}

# Good - runs at 20Hz
loop {
    check_sensors()
    delay(50)  # 50ms between iterations
}
Memory issues
Cause: Creating objects in loop without cleanup.
# Bad - memory grows forever
loop {
    var data = read_all_sensors()  # New object each loop
}

# Good - reuse variable
var data = {}
loop {
    data = read_all_sensors()  # Replaces old value
}
Debugging state machines
For complex plans with states:
plan StateMachine {
    var state = "idle"
    var prev_state = ""

    loop {
        if state != prev_state {
            log("State change: " + prev_state + " -> " + state)
            prev_state = state
        }

        if state == "idle" {
            # ...
        } else if state == "searching" {
            # ...
        } else if state == "avoiding" {
            # ...
        }

        delay(50)
    }
}
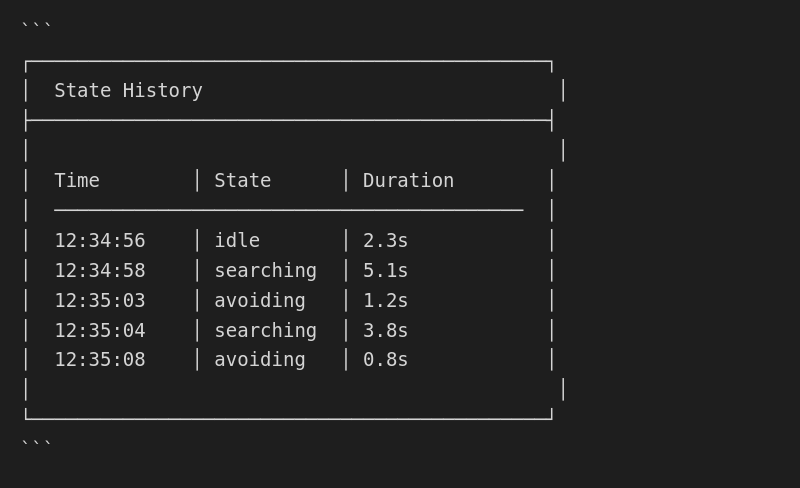
State history
Enable state logging:
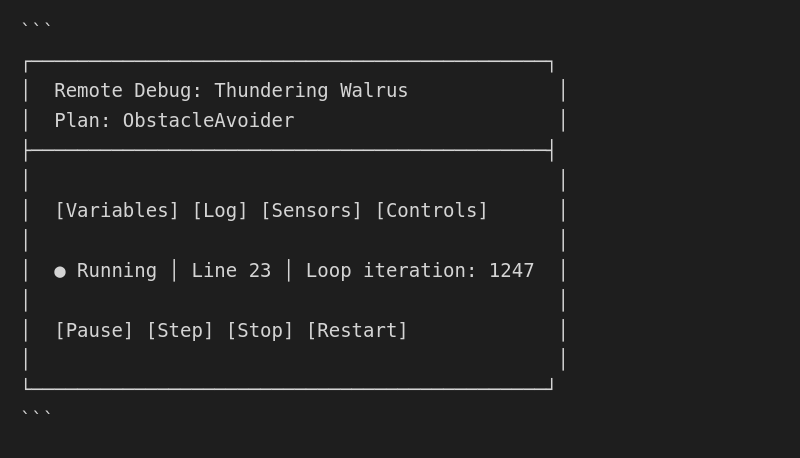
Remote debugging
Debug plans from a connected Remote:
- On Remote: ☰ Menu → Utilities → Plan Debug
- Select the Agent and Plan
- Access all debugging tools remotely
Debugging tips
- Start simple - Get basic behavior working first
- Log generously - More logs = easier debugging
- Test sensors first - Verify readings before using them
- Use watch - Monitor key variables continuously
- Check edge cases - What if sensor reads 0? 999?
- Isolate problems - Comment out code to find issues
- Version control - Save working versions before changes