Run a marching campaign overnight and browse every frame it drew in the morning
Compare ray-marching strategies with Render Lab
Render Lab is the ray-marching benchmark browser. Where Mesh Lab answers "which export pipeline gives the better mesh", Render Lab answers "which marching strategy draws this scene correctly, and what does it cost" — with every frame it drew kept for inspection.
The workflow is the same shape: run a campaign in the background, browse it afterwards.
Run a campaign
Campaigns are run by the raybench tool, which ships beside the app:
raybench run --lab labs/gen4.json --out raybench-out --db raybench-out/raybench.sqlite
A lab file is the experiment: which scenes, which camera sweeps, which strategies, and which settings for each. Omit any of them and the shipped set is used, so the shortest useful campaign is:
raybench run --out raybench-out --db raybench-out/raybench.sqlite
Every scene is measured against exact geometry — the benchmark scenes carry closed-form answers, so "did this pixel hit the surface" has a right answer to compare against rather than another renderer's opinion.
Two flags worth knowing:
--ciruns only the regression set: each scene on the camera sweep and settings it is meaningful under. This is what the build gate runs.--forcere-runs rows already recorded. Without it a campaign resumes where it stopped, so an interrupted overnight run picks up rather than starting again.
Browse the results
Open Render Lab from the apps menu and press Open results DB…. Plates are found beside the database, so a campaign copied off another machine browses whole as long as the folder came with it.
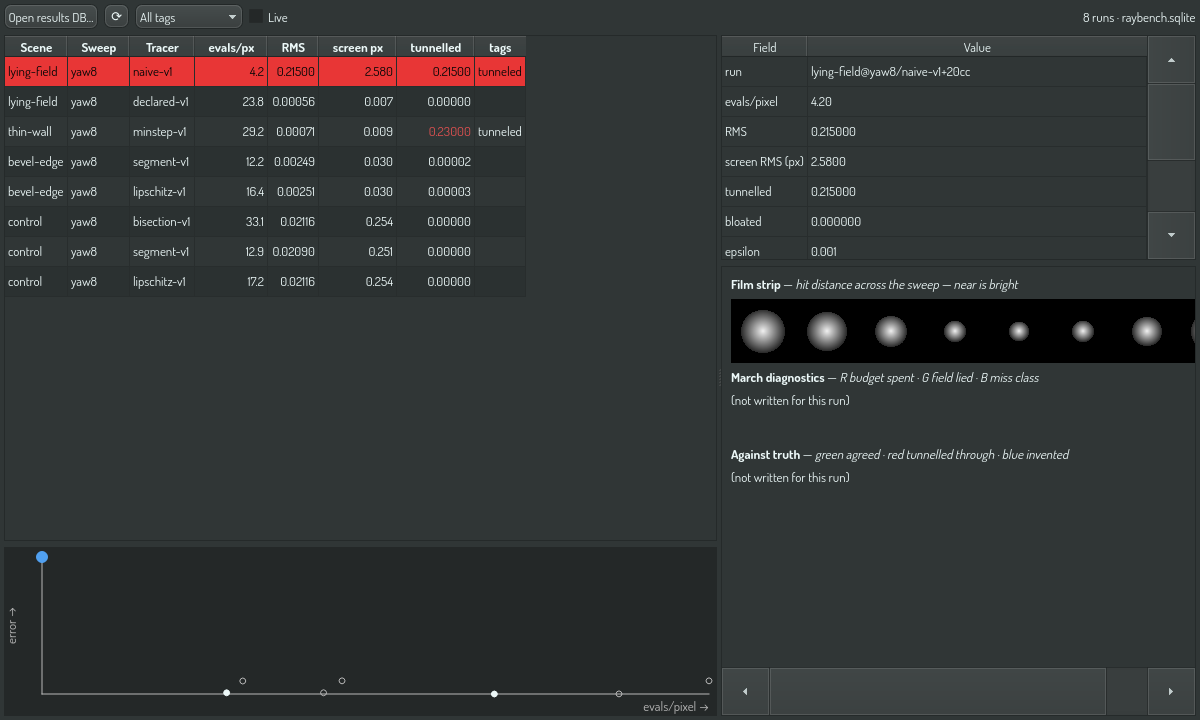
The table is one row per run, sortable by any column:
| Column | Read it as |
|---|---|
| evals/px | cost — how much work the average pixel took |
| RMS | how far the surface landed from where it really is |
| screen px | the same error in pixels, which is what a viewer notices |
| tunnelled | fraction of pixels that walked through the model |
Tunnelled is the column that matters most. Cost is a trade and error is a gradient, but a tunnelled pixel is geometry that did not get drawn, and no amount of speed compensates. It is coloured harder than the others for that reason.
The Pareto front
Under the table, each run is a dot: cost across, error up. Filled dots are on the front — nothing else is both cheaper and more accurate. Hollow dots are beaten on both counts by something else and can be ignored, however good their individual numbers look.
This is why the scatter is there and not just a sorted table: "best RMS" and "cheapest" are usually different runs, and the interesting answer is the handful that are not beaten on both.
Inspect a run
Select a row to see everything it produced:
- Film strip — the hit distance across every frame of the sweep, near is bright. The failure this whole benchmark exists for is variance across viewing angles, so a strip that flickers between frames is the finding, not a rendering artefact.
- March diagnostics — the same channels the viewport's debug view shows (see Ray-marching quality).
- Against truth — green where the run agreed with exact geometry, red where it walked through the model, blue where it invented a surface.
The tuning is listed exactly as it was run rather than summarised, because those numbers are the experiment. Copy them into a lab file and the run reproduces.
Watch one run
Tick Live and the browser re-reads every two seconds. A campaign commits each row as it finishes and writes the plates beside it, so a running campaign fills in in front of you — including one started from a terminal, or by the build gate.
Use the tag filter to jump to what went wrong: tunneled, slow and
bloated are applied automatically at the same thresholds the
command-line ranking uses.