Troubleshoot rendering problems
The Construct renderer protects itself against GPU overload: it caps oversized allocations, recovers from driver resets, and tells you what it did through toast notifications. This guide explains each of those messages, why they appear, and what to do about them.
All the settings mentioned below live in the Rendering dialog (the Rendering button in the Construct toolbar), Options tab, under the Antialiasing group.
My viewport went black or anti-aliasing turned itself off
If the GPU driver resets while Construct is rendering (a "device loss" — typically caused by another application crashing the driver, a driver update mid-session, or an allocation the GPU could not honour), the viewport recovers automatically. When that happens you will see a toast notification:
GPU recovered — QRhi reported device loss and was recovered. Anti-aliasing dropped from <strategy> to Off — re-select in Render Options when the driver is stable again.
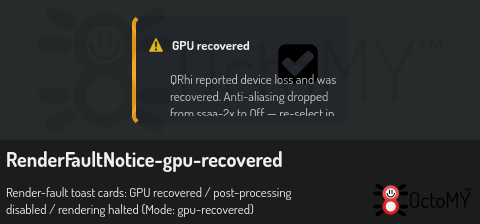
"Off" means the renderer switched to its no-anti-aliasing mode: the scene renders normally, but silhouette edges look harder/more stair-stepped than before. This is deliberate — anti-aliasing is the most allocation-hungry part of the pipeline, so it is the first thing dropped when the driver is unstable.
To get your anti-aliasing back: open the settings window (Ctrl+,), open the Shading category, and choose the strategy the toast named in the Antialiasing row again. If the driver is healthy again it will stick.
Two related toasts escalate when the driver keeps failing:
-
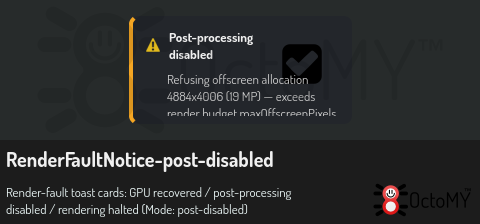
Post-processing disabled — the renderer refused an offscreen allocation (or lost the device three times within a minute) and now renders in a simpler single-pass mode. Bloom, tone mapping and dither are off; the scene stays interactive.
-
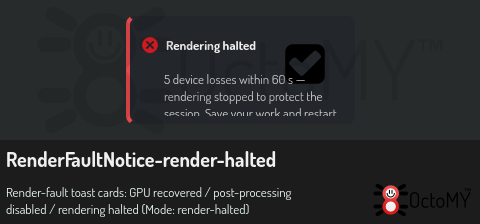
Rendering halted — five device losses within a minute. The renderer stops submitting work entirely to avoid wedging the machine. Save your work and restart the application; if this recurs, update the GPU driver and see Diagnostic mode below.
My queued export failed with a device-lost error
A queued render export runs the same fault detection. If the GPU is lost mid-job, the export worker releases everything, re-initializes the renderer, and retries the frame once. Only if the second attempt also fails does the job fall back to placeholder frames and record the error.
Where to look:
-
Jobs panel — the failed job's row carries the error text, e.g.
QRhi reported device-lost mid-batch — export frame skipped.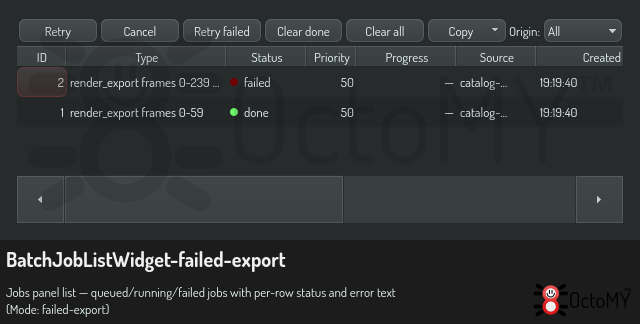
-
Application log — the worker logs the retry decision (
QRhi device-lost at frame N — releasing + retrying once) and, when the retry fails, the reason the re-initialization did not succeed.
If a specific export reproducibly triggers the loss, the job is most likely too demanding for the GPU. Adjust the render preset before re-queueing:
- Lower the Resolution on the Export tab (device losses are strongly correlated with very large render targets).
- Switch Antialiasing from SSAA to FXAA or Off — SSAA renders at up to 2× the resolution in each direction, quadrupling memory demand.
- Reduce the frame range to bisect whether one specific frame (e.g. a heavy procedural scene state) is responsible.
The AA dropdown marks some options with a warning sign
The choices of the Antialiasing row are checked against your machine's render budget — the allocation ceiling probed from the GPU at startup. A choice marked with a warning sign (⚠) and "(capped on this GPU)" has a resolution or sample-count demand that would exceed that budget on a Full-HD viewport.
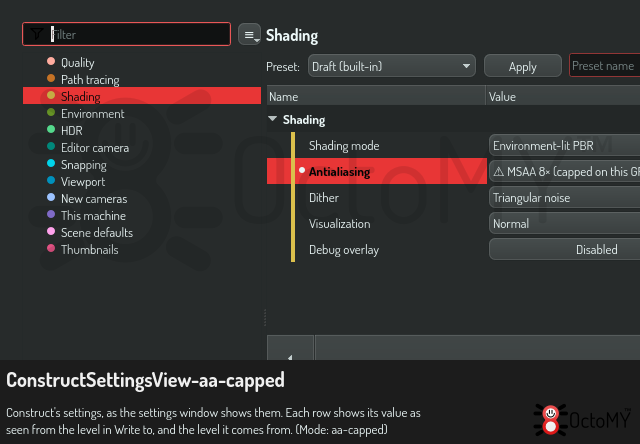
Antialiasing is in the settings window (the settings button of the toolbar, or Ctrl+,), category Shading. It can be set for the scene, and overridden per camera on the camera inspector — see where settings live.
You can still select a marked option — this is informed consent, not a hard block. When the renderer hits the cap it scales the request down to fit instead of failing:
- An SSAA resolution demand above the budget renders at the largest scale that fits (you keep some supersampling).
- A sample count above the budget clamps to the budget maximum (typically 4×).
If the capped request cannot fit even at 1× scale, post-processing is disabled for that session and the Post-processing disabled toast tells you why.
On machines with more GPU memory the budget is probed higher at startup, so the same option may be unmarked on one machine and marked on another — the warnings describe this machine, not the scene.
Diagnostic mode
If you are helping reproduce a rendering bug (or filing one), run the application with the Vulkan validation layer enabled:
./hub --rhi-validate
This loads VK_LAYER_KHRONOS_validation, which prints detailed
Validation layer: messages to the log whenever the renderer does
something the Vulkan specification disallows — usually the precise
cause behind a device loss. Debug builds enable it by default;
--no-rhi-validate turns it off when it is too noisy.
Attach the validation output from the first occurrence of the problem to your bug report, together with the GPU model and driver version from the log's startup banner.
The layer must be installed for the switch to do anything, and the log says whether it was. Where to get it on each platform, the second switch for offscreen work, and how a build can ship the layer are in Run with the Vulkan validation layer.